Tools to monitor Linux Cloud Server's resource usage and statistics
Monitoring a Linux server's resources is crucial for system reliability. You can use built-in tools or additional ones for real-time insights into CPU, GPU, memory, and storage. Failing resources can impact server performance. This guide shows how to monitor resource usage using utility tools for better system administration.
Before you start:
- Access the LayerStack Linux server using SSH as a non-root user with sudo privileges.
- Update the server to install additional tools.
TOP
Top is a command-line utility that shows live data about server resources and processes. It presents a dynamic interface with system details, CPU and memory usage, and currently active server processes or threads. Using the top interface, you can monitor and terminate server processes to enhance system performance.
By default, top is available in the default procps-ng system package. In case of any errors or unavailability, install the package using the default system package manager.
Debian/Ubuntu:
# sudo apt-get install procps
CentOS/Rocky Linux/ RHEL-based systems:
# sudo apt-get install procps
Run the top command:
# top

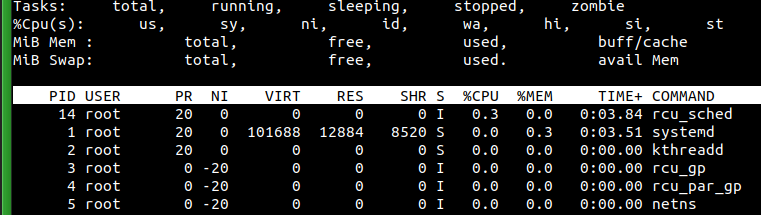
The top interface is divided into the following sections:
System Information: Display real-time system information with the time, uptime, number of logged in Linux users, and load averages.
Tasks: Display the total number of running tasks, active, stopped, and dormant processes on the server.
CPU Usage: Display the CPU usage percentages including the time spent on system processes and the average Input/Output (I/O) processing time.
Memory Usage: Display the server memory usage statistics including used and available memory.
System Processes: Display all running processes available on the server.
Within the section, each header represents a specific value as described below:
PID: The unique process id of each task on the server.
PR: The system process priority, a lower number represents a higher priority.
VIRT: Total virtual memory in use by a process.
USER: The system user that owns the running process.
%CPU: The percentage of CPU usage occupied by the process.
SHR: Represent the process Shared Memory size in Kilobytes.
NI: The process niceness value. A negative value represents a higher process priority while a lower priority uses a positive value.
%MEM: Display the memory usage percentage occupied by the process.
RES: Display the amount of resident memory used by the process in Kilobytes.
COMMAND: The server command under which the process runs.
Press Q to exit the top interface.
Free
The 'free' utility is an inherent tool showing details on server memory usage. As a component of the default procps utilities package, it enables you to check both available and used memory on the server. This encompasses the default system memory (RAM) and SWAP memory borrowed from the disk. Execute the 'free' command along with your preferred memory measurement parameter to observe active usage statistics.
By default, the free command without any option displays memory usage in Kibibytes.
# free
To modify your memory measurement value, use any of the following options:
-b: Bytes
-k: Kibibytes
-m: Mebibytes
-g: Gibibytes
--kilo: Kilobytes
--mega: Megabytes
--giga: Gigabytes
To generate a more readable output, apply the human-readable option -h to display the server memory usage in Megabytes.
# free -h

Below are the command sections:
Mem: The main Linux server memory (RAM)
Swap: Swap memory
Total: Total memory size
Used: Display the amount of used memory
Free: Display the amount of free unused memory
Available: Display the amount of memory available to run system applications without switching to swap memory.
DF
Disk Free (DF) is an integrated Linux utility designed for monitoring server disk space usage and data directories on attached storage devices. This tool provides insights into available file system directories, utilized space, free space, and mounting locations for each storage device connected to your server.
# df
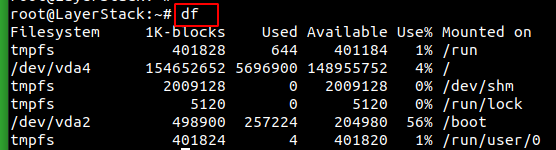
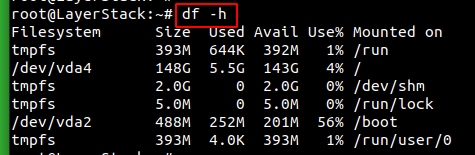
df displays disk usage in Kilobits. To view data in a human-readable form of Kilobytes, Megabytes, and Gigabytes, use the -h option.
# df -h
VmStat
The Virtual Memory Statistics (VmStat) utility is an inherent tool that presents real-time data on system memory, virtual memory, paging, and CPU activity. Serving as a crucial instrument, it enables continuous monitoring of Linux server performance, identification of memory-related issues, and analysis of how running processes leverage the existing system resources.
By default, VmStat is part of the Linux procps-ng package, to use the tool, run the vmstat command.
# vmstat
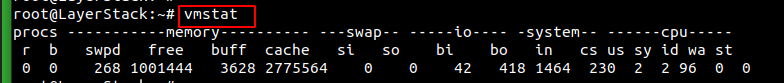
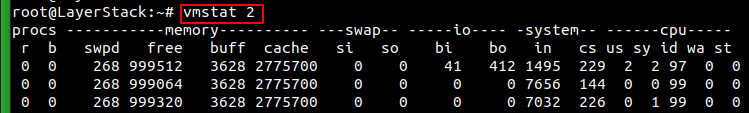
Below is what the vmstat information categories represent:
procs: Process information about actively running processes.
memory: Server memory usage statistics.
swap: Available Swap memory usage processes.
io: Input and Output information that includes blocks sent in and out to the server storage devices.
system: System-related statistics including interrupts and the number of context switches per second.
cpu: CPU usage statistics with the average processing time in each space.
The available options include:
-a: Views the active server memory statistics and displays active and inactive memory pages.
-m: Displays information about the server Kernel slab cache memory usage.
-n: Shows column headers only once instead of every update interval.
-s: Displays a summary of memory usage, CPU and I/O statistics.
-d: Displays disk I/O statistics including read and write operations to storage devices.
-S: Sets the memory size display units. For example, vmstat -S M displays the memory values in Megabytes.
-t: Includes a timestamp on each output line.
To update the VmStat output after a specific time, include the time range as a command option. For example, update the output after every 2 seconds.
# vmstat 2
Uptime
Uptime, a fundamental Linux utility, tracks server uptime, actively logged-in users, and system load averages. This tool allows you to monitor server boot time, CPU idle time, and the duration of uptime since the last reboot.
# uptime

PS
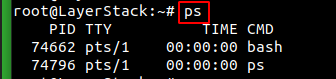
The Process Status (PS) utility is a command-line tool integrated into Linux, providing information about currently active processes on your server. This tool enables you to observe processes initiated by all users, a particular Linux user, or system daemons. Moreover, you have the option to refine the displayed information using the grep utility, allowing you to search for specific processes on the server.
# ps
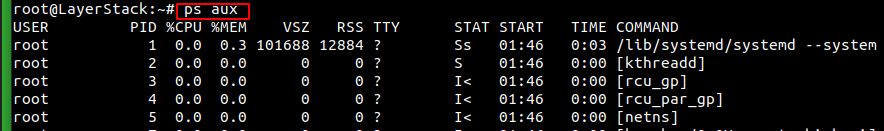
To view all actively running processes on the server across all terminal sessions, use the aux option.
# ps aux
Htop
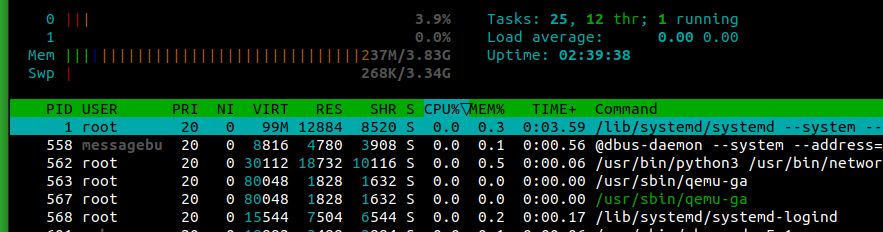
Htop serves as an interactive system process viewer, presenting real-time details on active server processes, CPU, and memory usage. It stands as an enhanced version of the native top utility, offering additional monitoring features and capabilities. To utilize Htop on your server, install the latest version through the default system package manager.
Install Htop:
Debian/Ubuntu:
# apt install htop
CentOS/Rocky Linux/Fedora/RHEL systems:
# dnf install htop
Output:

Lsof
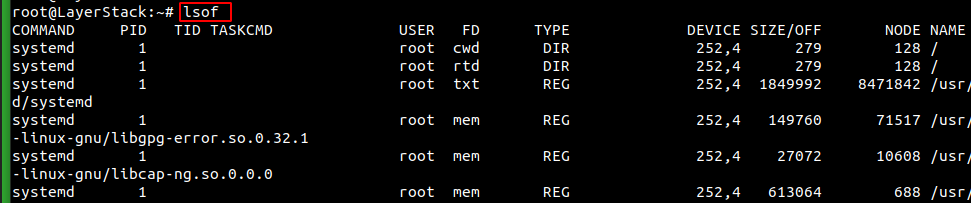
The List Open Files (lsof) tool is an integrated utility that showcases details about all open files and directories currently utilized by system processes. This tool enables you to monitor active directories and server processes that are actively employing specific files on the server. When using lsof, initiate the command with sudo privileges to view all processes, or target specific processes by utilizing their corresponding process ID.
# lsof
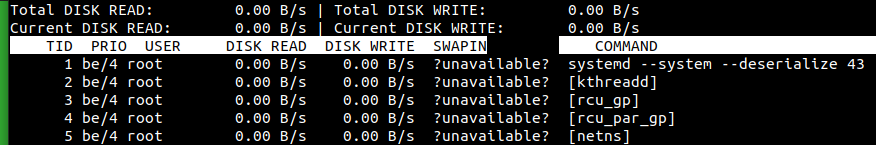
Iotop
Iotop is a tool for real-time, interactive monitoring of Input/Output (I/O) processes. It provides a dynamic view of processes or threads currently accessing the server's storage devices. This tool aids in identifying processes that utilize the most disk I/O bandwidth and offers insights into how various processes interact with storage devices. The output includes details such as read-write speed, time spent on swapping, priority class, command, and respective process users, facilitating active event tracking on the server.
Install iotop:
Debian/Ubuntu:
# apt install iotop
CentOS/Rocky Linux/Fedora/RHEL systems:
# dnf install iotop
Output:

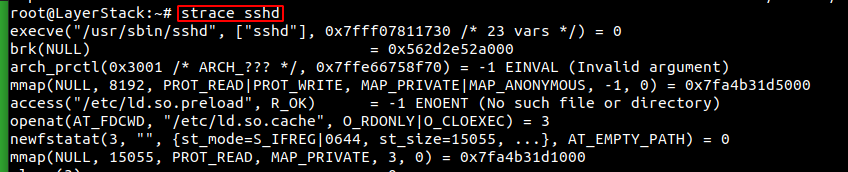
Strace
Strace, a diagnostic utility tool for Linux, monitors system calls and signals. It tracks the system calls made by a specific program or command until its completion, as well as the signals received during the process. This capability enables you to observe the performance of Kernel state functions while executing a particular command for debugging and troubleshooting purposes.
Install Strace:
Debian/Ubuntu:
# apt install strace
CentOS/Rocky Linux/Fedora/RHEL systems:
# dnf install strace
Output:
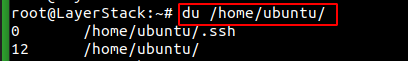
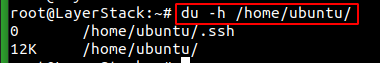
Du
The du command in Linux is a robust tool designed for analyzing and reporting disk usage across directories and files. Whether your aim is to pinpoint directories consuming excessive space, optimize disk space management, or gain insights into storage consumption patterns, the du command offers valuable functionality.
# du [options] [directory/file]
Output:
-h or --human-readable: Displays sizes in a human-readable format (e.g., KB, MB, GB):
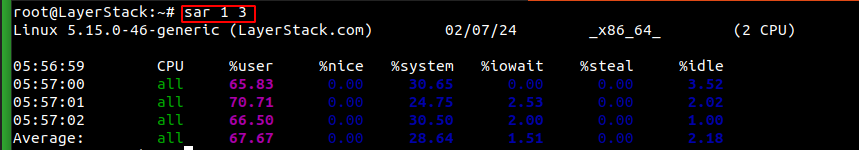
SAR
The sar (System Activity Report) command serves as a comprehensive tool for monitoring various resources on a Linux system. It provides insights into CPU usage, memory utilization, I/O device consumption, network activity, disk usage, process and thread allocation, battery performance, plug and play devices, processor efficiency, file system operations, and more.
Install SAT:
Debian/Ubuntu:
# apt install sysstat
CentOS/Rocky Linux/Fedora/RHEL systems:
# dnf install sysstat
To start SAR service:
# systemctl start sysstat.service
Output:
Conclusion
You've employed Linux resource monitoring tools to monitor server CPU usage, memory utilization, system processes, and Kernel messages. To optimize server performance, it's essential to regularly review the output of each tool, allowing you to effectively manage high-resource processes or consider necessary resource upgrades.
Related Tutorials